


Investigating the conformational freedom of proteins
In this second focus we present one of the few techniques able to extract information about the conformational freedom of proteins in solution. Flexibility is a key feature that allows proteins to work their functions inside the human body. In general the problem is mathematically under determined, so that additional hypotheses are needed.
This focus is the continuation of a previous focus. Flexibility of proteins can be determined for instance from the RDC of a molecule. The actual values of the RDC depend on the orientations of some dipoles (often the N-H couples of the various amino acids) with respect to a system centered in the paramagnetic ion. If the dipoles belongs to the same rigid domain as the metal, the spread of the values obtained is large since the orientations may be tought as a random distribution. On the other hand if the dipoles belong to a domain which has some conformational freedom with respect to the metal, the value obtained will be the average of the values of the sampled orientations. The averaging process tends to reduce the obtained values, so the conformational freedom can be established by looking at the measurements.

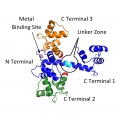
Consider calmodulin as a test case. The fold of the protein (shown in blue in the figure) is made by two rigid domain, the N and C terminals. When in solution the long alpha-helic breaks and the C terminal, still connected by a flexible linker (not shown in the picture) may assume different positions. Two such states are shown in the figure corresponding to the numbers 2 and 3.
The temporal scale of the single fluctuations in the fold of a protein is several orders smaller than the time of the NMR measurements, so that information about the flexibility can be only be recovered as a probability function on the set of allowed states.
The problem is severely under-determined. At most 25 constraints can be determined from any number of RDC (see for instance this paper). In the last decade or so, many methods using different models and measurements have been proposed in order to determine the best solution. Loosely speaking there are two different, often complementary approaches.
A first approach is to find the solution which minimizes the additional hypotheses on the data, thus using the Maximum Entropy Principle (MEP). The MEP solution maximizes the uncertainty on the data, so each feature shown by the MEP solution is relevant. On the other hand the MEP solution is in general a continuous probability distribution, so that a large number of states is normally needed in order to approximate it. The large number of variables involved raises not easy computational issues.
A second approach is to find if the measurements carry some preference for certain states. The Maximal Allowable Probability (MAP) is the largest weight of a given state in a probability distribution which is a solution. As a function of the state, the MAP is not a solution but a sharp bound from above of all the probability distributions satisfying the restraints. The zones with a large MAP are the positions where the largest asymmetries determined from the measurements can be found. On the other hand it is not possible to establish to what extent the true distribution shows these asymmetries.
The two approaches coincide in the extremal cases, i.e. when the conformational freedom is minimal and when there are no restraints to the allowable states. To know more about the available techniques follow the proposed link.